Tomorrow will be one week since a Promethean Board was installed in my classroom. And I can't say enough good things about it.
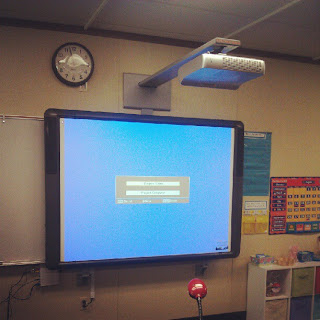 |
| Moments after installation |
In playing around with the program ActivInspire I've noticed that my PowerPoint skills have come in quite handy! The flip charts are very similar to PowerPoint.
One of the first ways I wanted to incorporate the board into my daily life was to create a Board Math template for topic 1. To do this, I must first create a "table" in Microsoft Word.
1. Hit return so that your cursor jumps down one level. I recommend ALWAYS doing this when inserting a table. It will save you headache in the long run should you need to move the table or add a heading at the top.
2. At the top of the screen, click on the "Table" tab and then click "insert", then click "table".
3. How ever many standards you have should be how many columns you need. I use Common Core standards, so I need four columns. Since it's the beginning of the year, I only want about 4 problems per standard. I also want to make sure that I have a row for the title of each standard, so set your rows to 5. Go ahead and leave it set to "auto". Your table should look something like this:
4. Change the layout of your paper to landscape. To do this, click "file" and then "page setup."
Make sure that the picture on the right (where it says "orientation") is highlighted before clicking ok.
5. You should make the table as large as you possibly can without going into the next page. To do this, simply click and drag the bottom right hand corner down to the right.
6. Now hover over the bottom of the line in the top row and then click and drag it up so it is now smaller than the other boxes.
7. Next, we should make the top row formatted to fit the labels. Starting at the left side top box, left click and drag all the way across the row. All the top boxes should now be highlighted. At the top of your screen, change the font to one of your choice and the size to about 10 and bold. We want the questions in the board math to be bigger than the top labels, so you can play around with the size later. Type in your headings on the top boxes.
Now start from the box below the top box in the left hand corner and do the same highlighting, only this time, go all the way down to the bottom right box. All boxes except the top row should be highlighted. Set these boxes to 20, but not bold (bold takes up too much space).
8. I like to have two word problems for my Operations & Algebraic Thinking column, so I want to merge the boxes. To do that, left click on the second box and highlight to the bottom of the third box, then right click so a menu pops up. Click "merge cells". You should now have two boxes below your far right column.
If you'd like the bottom box larger, simply click on the line separating the two and drag it up like you did to make the top boxes smaller.
9. Now it's time for the fun part. Add all the questions you'd like in each box. Make sure that you don't put specific numbers in. This is one week's worth of board math. You simply erase the specifics each day. The idea is that the students are getting repetition of how to do the problems. Here is what my bare bones Topic 1 (first week) of EnVision Math for first grade looks like:
 |
| To make the cup shape, I simply clicked on "insert" then "shape." To change the color, I right clicked on the shape, then clicked on "format shape". |
10. Make sure you save your work! BUT we have to save it as a PDF in order to insert it into our flip chart. To do that, at the bottom of the screen when you are at "file" then "save", or "save as", it should say "Format:" Make sure to click "PDF". This saves it sort of like a picture that cannot be changed. Close the file when done.
11. Next, open your new flip chart. Click on "import". This is important! Do not click "insert". It will not let you insert the PDF, only a picture of a PDF file. Once you click "import", then click on your file that has "PDF" attached to the end of it. If you open the file with "doc" at the end, it's not going to work. It should look something like this:
12. Last, to jazz up my board math, I've add shapes that act as manipulatives for some problems, and then used squares to make the data chart. These can be duplicated by clicking on them the click "duplicate" so that if I need more, they are the same size/color.
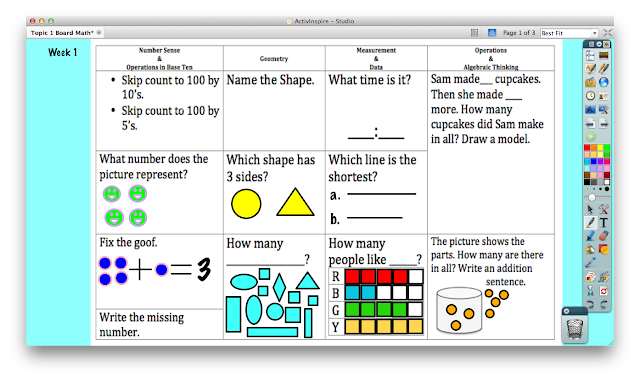 |
| Here is my finished product! |
13. AND very last...BE SURE TO SAVE IT!!! I'm always the one who saves saves saves, then suddenly forgets to save and then something happens....in fact, that happened while I was typing this blog entry! Yeesh...some teachers never learn!


